Dig Deeper: Using Data to Ask Better Questions

“We interpret data differently based on where we stop asking questions.“ – Kelsey Arendt, customer success manager, Parse.ly
We’re a data-driven bunch here at Parse.ly, so we rely on our own analytics dashboard to create a purposeful blog content strategy. As we prepare for 2017, we’re looking back at our data and starting to ask questions that will help us plan for the future.
Doing the same? Here’s our plan of attack.
Start With What Worked
We started with a list of our most-visited blog posts over the past year. Understanding what the data is telling us can help us to develop more strategic content moving forward.
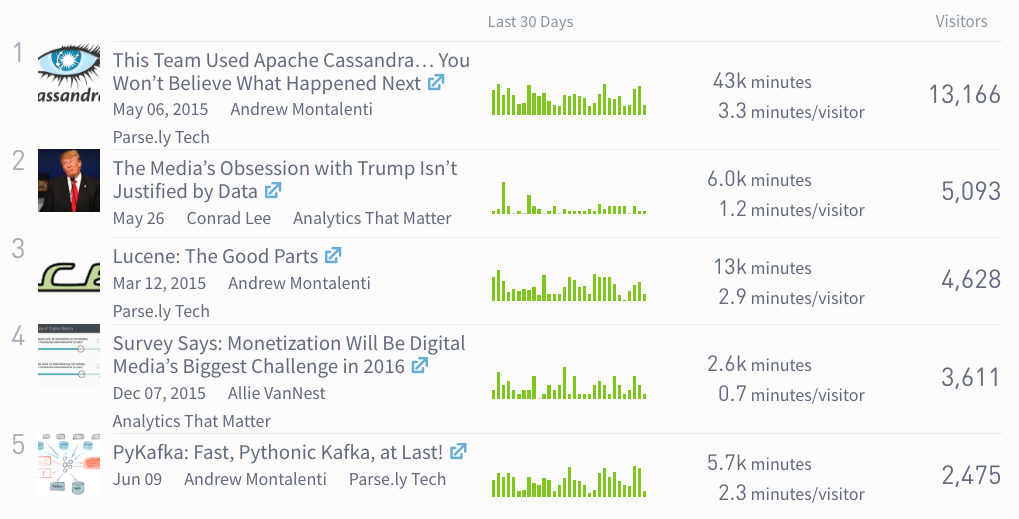
It is pretty clear that Parse.ly CTO Andrew Montalenti wrote one of the most successful posts on our company blog: “This Team Used Apache Cassandra . . . You Won’t Believe What Happened Next.” Not only did the post attract the most visitors, but these visitors were engaged for a whopping 3.3 minutes (longer than the average engagement time of any other post in the list).
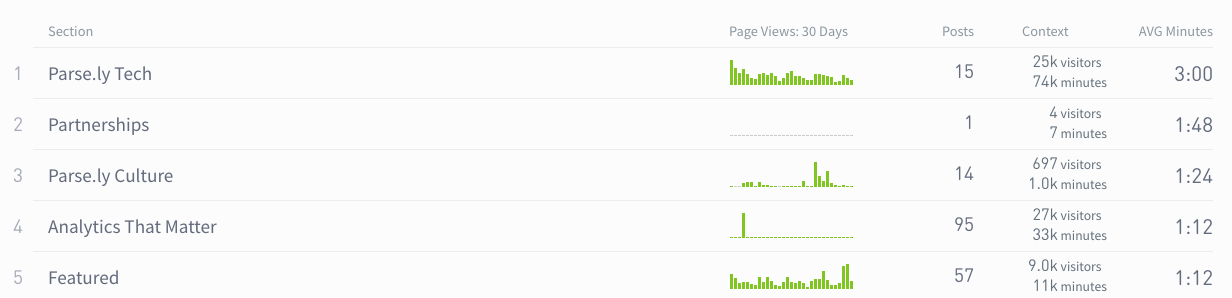
Delving into a section overview, below, we can see even more clearly that technical posts (Parse.ly Tech) receive significantly more engagement than other types of posts, despite the fact that data-focused posts attract more visitors. Since three of the top five posts over the past year have been part of our Parse.ly Tech section, it is clear that this section is somewhat of an outlier — attracting a different type audience than other posts.
Learning What Not To Do from the Most Popular Section on Our Blog
Says Customer Success Manager Kelsey Arendt: “You would never compare the success of a long-form investigative journalist against short-form sports writers who crank out several stories per day and get millions of hits. They serve different purposes for different audiences, so they have different KPIs.”
In the same way, our Parse.ly Tech posts are long-form, informational posts that appeal to a highly technical niche audience. Although the data tells us they are our most popular posts, they don’t attract the target audience (of largely non-technical digital media professionals) that we seek. So, we can’t equitably compare the performance of tech posts to data posts.
Instead, we can choose to focus on one of two possible editorial strategies given the information at hand:
- Replicate the success of Parse.ly Tech elsewhere. Data tells us that our tech content performs differently than other types of blog content. But, can this niche following be replicated? We could more closely examine what makes our tech content work and apply these learnings to other areas of our blog.
- Recognize that Parse.ly Tech serves a unique audience, and dig deeper. Understanding that we can’t measure other posts with the same KPIs as our Parse.ly Tech posts, we chose to exclude tech posts from the data we use to make editorial decisions and look at ways to improve our general and data-driven content based on the additional metrics we are able to collect.
Digging Deeper: Examining Trends Among Non-Technical Posts
The dashboard below tells us that our top non-technical post over the past year was a data-focused piece, “The Media’s Obsession with Trump Isn’t Justified by Data,” written by Data Analyst Conrad Lee. It appeared in our Analytics That Matter section. The post received more than 5,000 visitors who spent an average of 1.2 minutes engaged with the content.
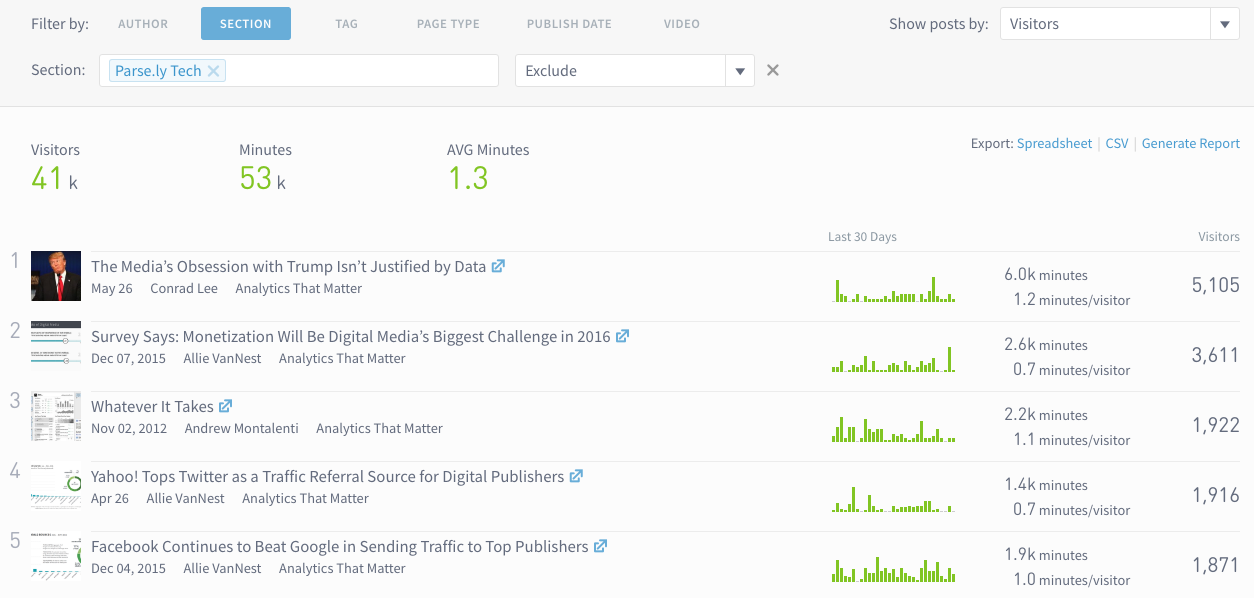
In fact, all of the top posts in the list were included in the Analytics That Matter section of our blog — suggesting that our readers are very interested in this type of data-focused post. Upon further examination, we can see that nearly 97 percent of readers of the Donald Trump post were new visitors. This, compared to posts on traffic referral sources (“Yahoo! Tops Twitter as a Traffic Referral Source for Digital Publishers” and “Facebook Continues to Beat Google in Sending Traffic to Top Publishers“), which draw in fewer new visitors — around 93 percent.
The takeaway? Trendy topics like Donald Trump earn us some traffic, but posts derived from data collected across Parse.ly’s network of digital publishers bring in a more loyal audience. If we were interested in increasing the number of loyal readers to our blog we could consider the following:
- What does this data suggest about our loyal readers?
- What do they want to learn from us?
- How does this inform what we write for them in the future?
Our loyal readers are interested in the unique insights that Parse.ly can provide to them from our network of digital publishers. They look to us to better understand what others in the industry are doing, and they want to receive as much information as possible to help them create informed editorial strategies.
Digging Deeper: Audience Engagement in Data-Focused Posts
Let’s visit the detail page for our Analytics That Matter section to confirm our hypothesis about reader engagement.
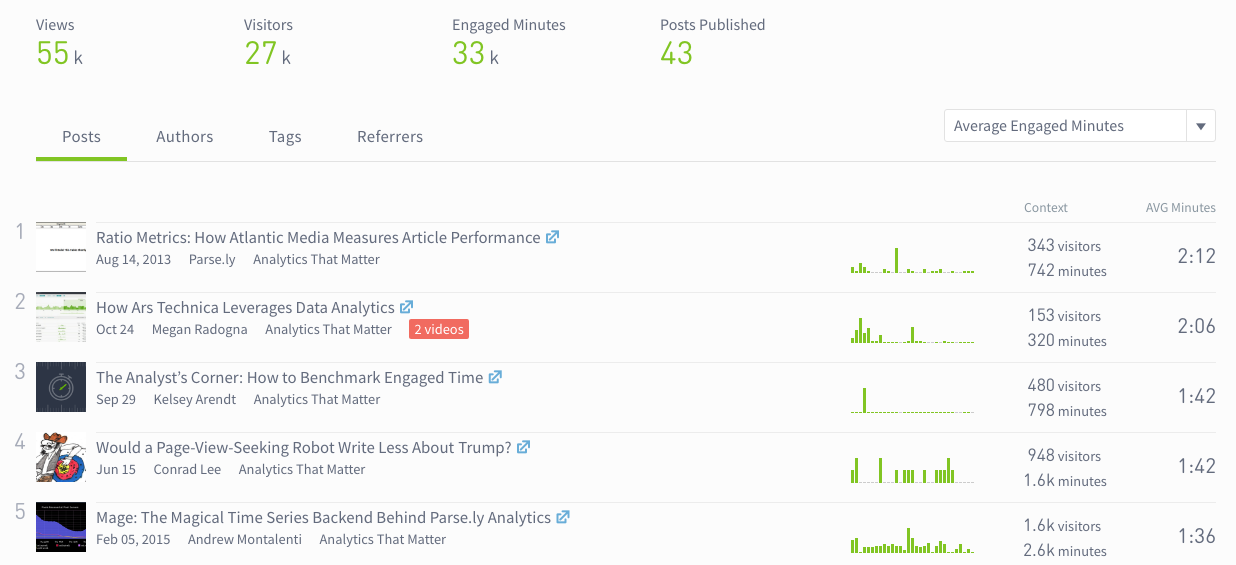
Although data-driven posts attract fewer visitors than tech posts, readers remain engaged for longer periods of time. The top two posts in this section, both demonstrating more than two-minutes of engaged time, are customer case studies — and one includes two videos!
Possible questions for consideration:
- Do videos increase engaged time on our site?
- What percentage of visitors to each of these posts are new vs. returning?
- Where are they coming from?
It would be easy to dig deeper into any of these questions to help fine-tune our editorial strategy. Or, we could take this data at face value and make decisions based on what we are seeing here: writing data-focused posts about customers could help us to increase reader engaged time.
Digging Deeper: Referral Traffic to Data-Focused Posts
Looking at referral traffic for our “Analytics That Matter” posts helps us answer the question posed above: Where are our visitors coming from?
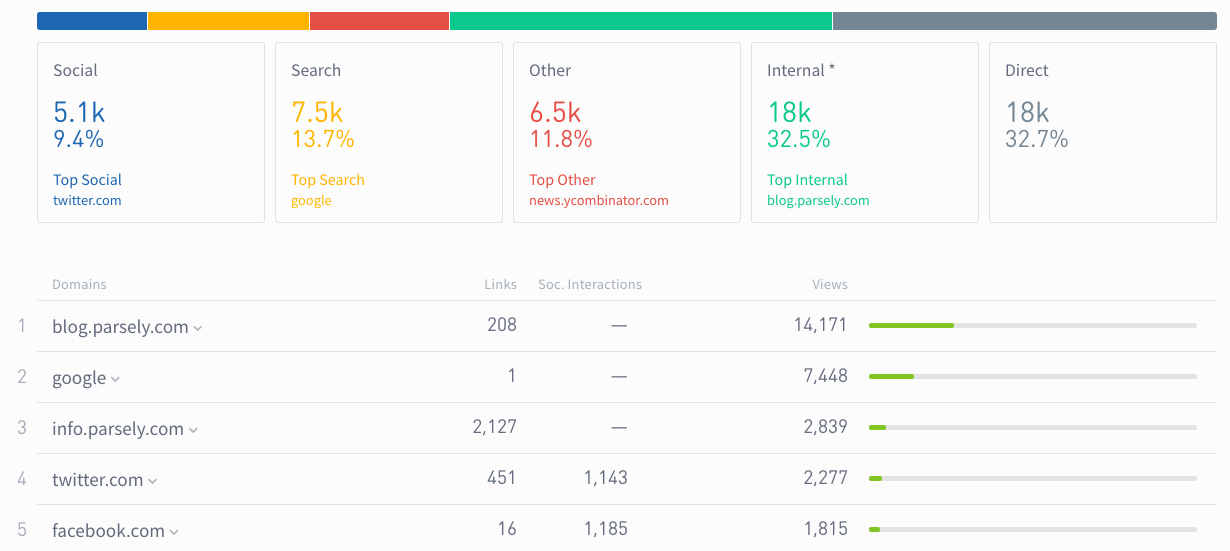
Here, we can see that most of our audience comes through our blog and direct traffic, and then finds our data-driven posts. This could mean that we’re featuring the posts nicely and/or our audience is seeking them out. From this information, we can determine where to feature our posts for maximum exposure.
Being Data-Driven Means to Never Stop Asking Questions
We’ll be the first to admit that this is a lot of information to pack into one blog post. But, the point is that data is not as black-and-white as we make it out to be. Reiterating Arendt’s earlier point: “We interpret data differently based on where we stop asking questions.“
Although our initial data pointed to Parse.ly Tech posts as our most popular, we decided not to focus on creating more tech posts because our audience there is so niche. Instead, we devoted our resources to figuring out what type of content our typical reader is most interested in consuming and moved forward from there. In this way, we were able to use data as a foundation for important editorial decisions, but not as a replacement for writers’ and editors’ gut instincts about what will resonate best with their audience.
A true data-driven newsroom is one that creates specific and actionable goals based on its unique audience, then considers all available data in context before making editorial decisions. And it is one whose editors and writers never stop asking questions.