How to make the most of your newsroom resources
It’s more important than ever before for newsrooms to find nuances that previously might have been overlooked. The media industry is in the midst of a shift, and while discussions on business models and the importance of metrics are an important starting point, how can organizations dive deeper and find answers that will help them rise above the status quo?
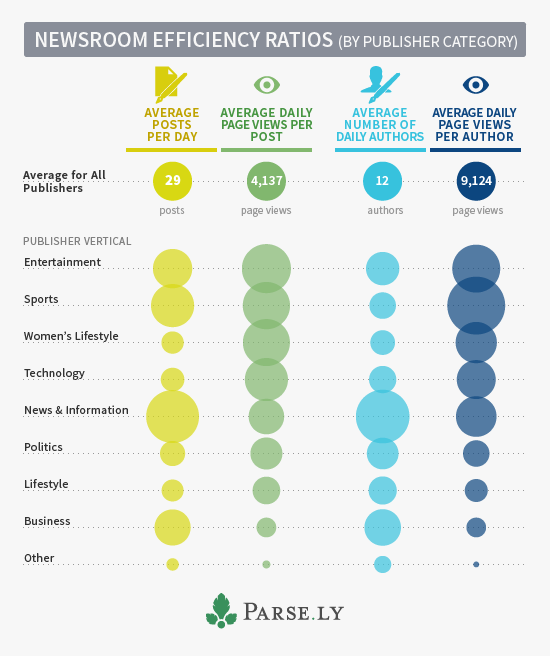
With our quarterly Authority Report, we search for those nuances and insights that, without analysis of industry-wide data, would be hidden. For our latest report, we examine the how a news site’s topic coverage area affects a newsroom’s resources and audience consumption habits.
Different topics have always had different needs. Sports and technology coverage aren’t completed in the same fashion, and require different types of knowledge and mediums. What can this data about audience consumption help digital publishers do differently?
For organizations getting off the ground, this indicates that strategies may be better organized around verticals than by overarching brand. PBS MediaShift covered how First Look Media’s titles will each stand alone, in a manner more similar to Time, Inc. than Buzzfeed. “In a way, the flagship site itself will be like a “general interest” publication,” reports Susan Currie Sivek. This decision makes sense given the data: media outlets that primarily cover general news and information see much less “return” in terms of audience views for each story and for each author. They produce more stories, employ more authors, but don’t see any increase in audience size, except at massive scale. Narrowing in on a niche, or creating an entirely new area of coverage is one way to maximize in a new market.
Just this week BuzzFeed’s Ben Smith spoke to this very strategy: “One of the advantages of starting from scratch is that you can rethink beat structures. Gay rights is this huge story of the last 10 years, but it’s covered as a B-list beat at a lot of publications just because it always has been. For us, it’s very much a frontline beat, and we’re able to hire the best reporters who really own that beat.”
For established newsrooms, understanding which areas see a larger increase in audience can help you make decisions about investing in existing resources. We don’t suggest anyone make personnel decisions based on this chart; we mean that using this type of information can allow editorial teams to find connections between verticals that they didn’t realize existed. Can the sports page and the business writers find overlap that helps growth? Can the tech beat and entertainment reporters create overlap and turn “passer-bys” into regular readers?
Connecting verticals in non-traditional ways is how data can create insights and nuance, and why editorial teams are finding more uses . As Patrick Juola recently was quoted in Fast Company: “The rigid calculus of computation, which knows nothing about the nature what it’s examining, can shock us out of our preconceived notions on a particular subject. When we read, we do so with all kinds of biases. Algorithms have none of those. Because of that they can take us off our rails and make us say, ‘A-ha! I’d never noticed that before.’”
There’s still plenty more to understand. This data doesn’t examine the depth of coverage or the loyalty of readership. Business and politics reporting may need significantly more context and background than entertainment or sports. And could it be that readers are more likely to be loyal to business and politics sites than they are to an entertainment or sports websites. Deciding on the importance of reader loyalty, amount of coverage, and depth of coverage is key for publications to determine in line with their business goals.
Exploring these areas and finding solutions has been the launching point for many interesting journalism start-ups like Medium, Circa and Upworthy (client). It’s also been a source of innovation internally at major media giants like the Atlantic (client) and The Guardian. What opportunities do you see in the newsroom data? We’ll be tweeting findings with #AuthorityReport.
This is part of our quarterly report series. Sign up to get it first: https://www.parse.ly/authority/2014/02 or contact authority@parsely.com with questions or suggestions for future topics.