Postmortem of Parse.ly’s Real-Time Outage (2016-06-09)
On Thursday, June 9, 2016, Parse.ly experienced a real-time data outage that lasted approximately 3 hours. No customer data was lost, but this did result in a delayed delivery of data from that 3-hour window.
Here, we will explain exactly what went wrong and what we did to address it.
A Sudden Downtime at 11:30am ET
The initial symptoms of our outage was the immediate ceasing of data delivery to our dashboard. The initial cause was unclear. No hardware or machines had failed, and with the exception of our data delivery monitors, no other systems reported any failures.
War Room Until 2:30pm ET
As is standard practice at Parse.ly, we established a “technical war room” to discuss what was happening and do live diagnostics on the system. We also informed customers of the outage immediately via Twitter and notifications in our dashboard.
Initial work focused on getting real-time data flowing again. Some engineers focused on obvious troubleshooting steps, like restarting our cluster machines, which seemed to have no effect. Other engineers looked over our system logs and monitors to determine root cause.
Around 1pm, though we did not have clarity around a true root cause, we did, at least, have a path toward resolution that could eliminate unrelated system variables and get the pipeline back online. This involved clearing our live systems of a few hours of data and bringing the clusters offline and back online from scratch, otherwise known as a “cold start”. We executed this procedure and by 2pm the data pipeline began working again. By 2:30pm, we had restored real-time functionality and tweeted about the resolution for customers.
Investigating Root Cause
In the hours that followed, our engineers continued to investigate root cause. We narrowed the field to three potential causes, and spent the next hours and days eliminating them until we settled on the true root cause, backed up by monitoring data and system log events.
The root cause of this failure was a combination of system automation and bad luck.
System Automation
Parse.ly runs a fleet of over 200 servers in production. To manage this large fleet, we use automated software which rolls out automatic updates and configuration changes to this software on a regular basis.
This system is called Chef, and it has the ability to:
- upgrade software versions, for security patches and the like
- change configuration settings cluster-wide
- upon configuration changes, execute service restarts
It was the second and third features which contributed to our outage, as explained below.
Bad Luck
Service restarts happen all the time inside Parse.ly’s data centers without issue. However, some services participate in a “cluster” that exists across several data centers.
One such cluster we run is for an open source service called Zookeeper. Zookeeper is a rock-solid distributed systems component used by many systems to coordinate “consensus” in a distributed environment. For example, Zookeeper can store small amounts of data on three nodes across three different data centers, and if any one node (or data center) is down, the other two nodes will form a “quorum” and still be able to serve requests. However, if two or more nodes are down, there will be no quorum and thus, the cluster will refuse to serve requests.
One of our Zookeeper clusters is used exclusively to manage a small bit of configuration related to our real-time data delivery. However, a regular run of the earlier configuration management program, Chef, restarted two of the nodes in our three-node cluster at precisely the same time. This caused the cluster to lose quorom and thus caused the services that relied upon it to malfunction in a temporarily-unrecoverable way.
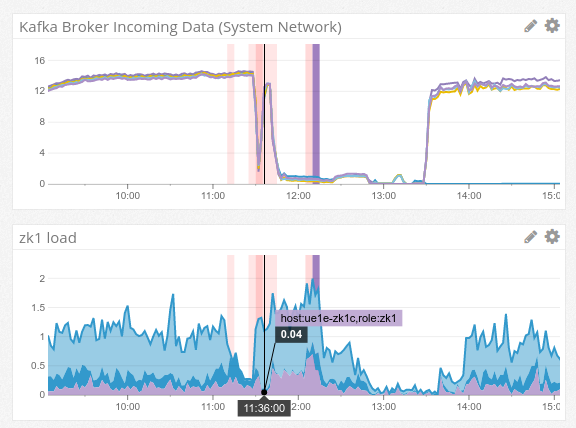
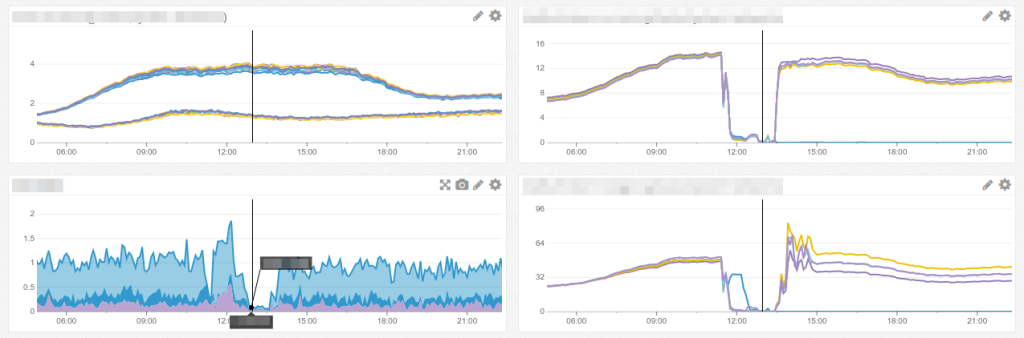
This graph from our monitoring system shows the clear cause-and-effect visually. The red bars are Chef run events, and the lines that drop off to zero show our real-time data suddenly ceasing its flow.
Chef uses a simplistic approach to determine when to execute service restarts. If there are any configuration changes, it restarts the service. To ensure restarts of all your changed services don’t happen at once, it “jitters” Chef runs across machines. For example, on some nodes, Chef will run every 10th minute of the hour. On other nodes, it will run every 35th minute of this hour (and so on). Since Chef is usually not running at the same time on different nodes, the chance that a service restart happens simultaneously on two nodes in the same logical cluster is low.
But though the probability of that event is low, it is not zero. In truth, with the number of nodes we now have, over time, it’s actually a very real probability. Even if you run once an hour at a random minute, it’s likely two runs will be simultaneous once you have hundreds of nodes.
So, the root cause is probably clear, now: we got “unlucky” and Chef automatically restarted two nodes that were part of the same logical cluster at the same time. They really needed to be restarted separately, one after the other.
Learning From This Outage
This outage has taught us a few important lessons:
- We have changed our opinion of automatic (“routine”) service restarts. We will now separate production configuration changes from production node restarts. For example, if Chef had pushed out configuration changes automatically but queued the service restarts to be done manually (or approved manually) by one of our engineers, the danger of this operation would have been immediately obvious.
-
As written in Google’s book on Site Reliability Engineering, we have internalized the harsh, but realistic philosophy of: “Hope is not a strategy”. That is, though Zookeeper is designed to survive single-node failures, we should not act as though multi-node failures are impossible. In large distributed systems, anything is possible, so our systems and processes should always have a “plan B” on-hand for rapid recovery.
To Our Customers
Our engineering team would like to apologize to customers who had to put up with missing real-time data on Thursday. We know this was a cause of stress and concern, especially since we had experienced a few smaller (and unrelated) real-time outages in May.
Rest assured: no data was lost — it is just late-arriving to our dashboard, reincorporated as part of our historical rebuild process.
If you have any questions, reach out to support@parsely.com.
Interested in helping us solve issues like this once and for all? We’re hiring — check out our job posting for software engineers for more information, and be sure to mention this post!