Where Is Your Site Traffic Coming From?

As of November 2016, Google and Facebook drove around 80 percent of all identifiable external traffic to digital publishers in Parse.ly’s network. This has been a concern for online media, who are impacted by even the smallest changes implemented by these sites — but may not have the tools to understand how or why.
Just look at what happened in June, when Facebook changed its algorithm to de-prioritize news feed updates from digital publishers. Many sites worried that this would negatively affect their referral traffic from the platform; so, Parse.ly built an interactive dashboard to help visualize how many visitors were being referred to content from Facebook across our network.
Today, we’re excited to expand the dashboard to show referral traffic from Facebook and Google, as well as other top traffic sources to our network of digital publishers.
Those of you familiar with our quarterly Authority Report will recognize this dashboard as an extension of the static “Top Referral Sources” graphs typically included at the end of each report—and may appreciate the continuous updates. You can track referral data by date and traffic source to get a better sense of how visitors are navigating to posts in the top online news sites. The referral dashboard allows you to compare the biggest referrers, like Facebook and Google, but also allows you to track and compare other meaningful sources of traffic that don’t get as much attention.
Insights: Google is Driving Significantly Less Traffic to Digital Publishers
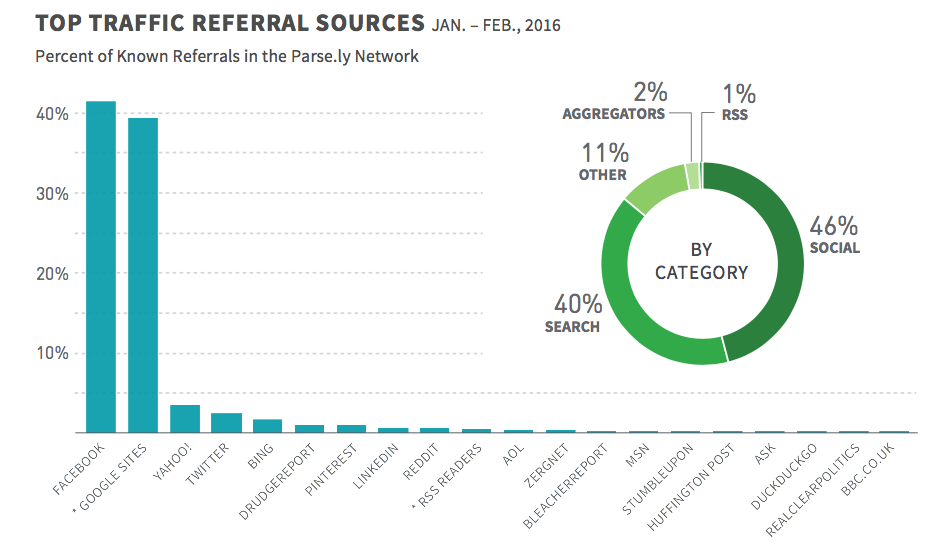
Almost one year ago, Parse.ly distributed an Authority Report that included information on top traffic referral sources to our network. At the time, we reported that Facebook was still driving a higher percentage of traffic to news sites (41.4 percent) than Google (39.5 percent).
But take a look at the referral dashboard. As of the publish date of this post, Facebook still serves as a leading traffic source (42 percent) for Parse.ly’s network of publishers, but Google’s influence (31 percent) has declined significantly. Yahoo!, which previously outpaced Twitter as a traffic source to publishers, has also declined as a traffic referrer; it now drives only 1.6 percent of all referral traffic to Parse.ly’s network of sites, a 5.2 percent decline over two years.
These numbers can look very different for individual sites, which is why we encourage everyone to understand their own traffic dynamics (for instance, through our dashboard, or through other analytics tools). Still, they serve as a useful indicator of industry trends.
Methodology: How We Calculate Industry-Wide Referral Averages
You’ll note that we’ve presented this data using confidence intervals. The thick line in the middle of the confidence interval represents the observed percentage of external referrals that came from each source to Parse.ly’s network of more than 700 digital media sites. However, we’re also curious about where these numbers lie for the digital media industry as a whole, not just for those sites that happen to use Parse.ly. We believe that the industry-wide values lie somewhere within the confidence interval.
Without tracking referrals from every site, we can’t be completely sure where the numbers lie for the entire industry. We can, however, use statistics to take a good guess at where these numbers lie. In particular, we use a technique called bootstrap resampling, which assumes that — while the customers we have reflect the industry as a whole — it might just be random chance that we track (or don’t track) one particular site. Our dataset could just as easily be missing a particular big customer or it could contain two or three similar customers.
Thus, the technique simulates several alternate realities: in each one we “resample” the data by building a dataset where each customer has a chance of being left out entirely, included exactly once (as in reality) be being included multiple times. For each of these alternate realities, we keep track of the share of referrals from external sources like Facebook or Google. By analyzing how these numbers vary from one simulation to the next, we can create confidence bounds. If the numbers jump around wildly from one simulation to the next, these confidence bounds will appear wider.
Although this data is a useful benchmark, it is important to remember that every site is different. That’s why it is so important for you to look at which sources are driving traffic to your own site, and to act on those insights.